API7 Gateway Upgrade Postmortem: Streaming 500s and Low-Traffic CPU Saturation From Two Independent Bugs
After upgrading our production AI gateway (API7 Enterprise, a commercial distribution of Apache APISIX) from 3.9.14 to 3.9.19-patch.1, two problems surfaced in quick succession: streaming requests intermittently returned 500 with the client receiving nothing at all, and multiple OpenResty workers on node 56 repeatedly ran near 100% CPU even though traffic had not visibly grown. A single upgrade tripped two mutually independent software defects — and on the most visibly affected node, a CPU frequency-governor difference stacked on top.
I will give the conclusions first, then walk back through the investigation. Hypotheses I later discarded are marked along the way so they do not blur into the final findings.
Conclusions first
Problem 1: intermittent 500s on streaming requests
- Root cause: while an SSE message was being reassembled from chunks, the old logic still flagged “needs flush.” When the background timer fired, the send interface returned
nothing to flush(which only means there is nothing to flush right now), but the code read it as a client disconnect and proactively stopped reading from upstream. The error occurred before any response bytes went out, so the client received nothing at all.- Trigger: it depends on the relative order of chunk arrival and the periodic flush, not on response length — which is why it comes and goes.
- Handling: temporarily set
streaming_flush_interval_msto0to bypass the background flush path; the temporary setting was removed after patch.3 fixed the state check.Problem 2: high CPU on multiple workers at low traffic
- Root cause: an index-sync regression introduced when
nginx-lua-prometheus-api7was bumped to 1.0.0-1. Re-registering an expired metric changes the globaldelete_count, and the next time other workers sync they perform an O(key_count) full slot scan. Thegetandttlcalls inside the scan repeatedly contend for the shared dict’s global lock, burning user CPU.key_countonly ever grows, so CPU consumption tracks historically allocated slots rather than traffic — low QPS alone is enough to peg the CPU.- Trigger: high-cardinality labels plus metrics with
expire: 1800constantly being created, expiring, and re-registering; the more workers, the more visible the contention.- Handling: rebuilding the Pods to zero the accumulated index only stopped the bleeding. The final fix rolled
nginx-lua-prometheus-api7back to 0.20250302-1, the version shipped with 3.9.14, delivered via a new patch while the gateway itself stayed on 3.9.19.- Impact: apart from the streaming 500s in Problem 1, no increase in 5xx was observed during the CPU anomalies; the main user-visible effect was slightly higher response times, which we did not quantify separately.
One-line lesson: a restart clears state; it does not fix a bug. And a software bug cannot explain “only one machine alerts” — that is an infrastructure difference at another layer, which needs its own investigation.
Background: the request path and the environment
The path is short:
1 | Client (Codex, curl, application code) → API7 gateway (3 nodes) → Azure (GPT-series models) |
The three nodes are 10.200.76.54, .55, and .56, 16 cores each. Both problems appeared after the upgrade; below I investigate them one at a time, and then look at the node-to-node difference.
A few terms that will keep coming up
Readers familiar with OpenResty can skip this section.
- shared dict and its lock:
ngx.shared.DICTis a memory dictionary shared by all workers. To keep concurrent access consistent, every read and write goes through the same mutex (ngx_shmtx_lock) — pure reads included. When multiple workers hit the same dict at high frequency, lock contention and spin-backoff burn user CPU directly; it never shows up as iowait. KeyIndexand three counters:KeyIndexis the slot-index cache insidenginx-lua-prometheus-api7, one copy per worker, used to avoid walking the dict from scratch on every lookup. It involves three numbers:key_count: the number of slots ever allocated historically; it only increases;delete_count: a global deletion counter; incremented whenever an expired metric slot is reclaimed and then re-registered;self.deleted: the worker-local snapshot ofdelete_count; if it disagrees with the global value, a full rescan is triggered.
expireandremove_expired_keys_interval: the first is how long a single entry lives (1800 seconds in this deployment); the second is how often the cleanup job runs (library default: 3600 seconds).- cpufreq governor: the kernel’s frequency-scaling policy.
performancetries to stay at high frequency;powersaveprefers dropping frequency to save power (behavior differs underintel_pstate, covered later). The same user-CPU work takes longer at a lower frequency and is more likely to trip an alert threshold.
Problem 1: streaming requests return 500
Conclusion first: patch.1 reworked the common streaming path, and the cooperation between message reassembly and the periodic flush turned out to be defective. Combined, they make the code misread “nothing to flush” as a client disconnect, aborting the upstream read. Because the error happens before the response is emitted, the symptom is a client that receives nothing and a 500 in the logs.
Symptom and three controlled comparisons
After configuring Codex to use the GPT-series models proxied through API7, errors started appearing in normal use — the client received nothing. The gateway access logs recorded 500 for the corresponding requests. I ran three comparisons first:
| Comparison | Result | What it narrowed down at the time |
|---|---|---|
| Same request body sent straight to Azure | Works | Reduces suspicion of upstream trouble or request-format problems; focus on the gateway |
Original request with tools removed, still through the gateway |
Works | Suggests the request shape affects the trigger, but does not prove tools was invalid |
Original request with stream set to false |
Works | Focus on the streaming processing path |
I took a detour here: the second comparison sent me down the wrong path for a while — I suspected some non-standard parameter inside tools. Only later did I learn it had merely avoided the trigger. Change the request shape and the relative order of chunk arrival and periodic flush changes with it, so whether you hit the bug is purely a timing question; tools itself was never invalid. Controlled comparisons narrow the search space, but the root cause still requires reproduction and code confirmation.
Reproduction
At first, switching upstreams failed to reproduce it. Once I had the full curl command, gateway logs, route configuration, and Azure streaming response, and replayed them against the same version image (3.9.19-patch.1), the problem appeared immediately. The key is preserving the original request and environment — omit either one and it may not reproduce.
Root cause: a new change tripping an old defect
Two parts.
One part: patch.1, to fix content moderation, changed the common streaming path. Some models’ streamed answers do not carry usage information, which could leave the complete answer unmoderated, so the gateway was changed to first collect one complete SSE message, then hand it to the downstream plugins for processing and sending. Requests with content moderation disabled also pass through this logic.
The other part: message reassembly and the periodic flush cooperate badly. A bit of background first — a single SSE message may arrive at the gateway split across multiple TCP chunks; incomplete content is buffered until the whole message is assembled. But the old logic still flags “needs flush.” The background timer fires at that moment, and the send interface returns nothing to flush. That return value only means there is nothing to flush right now; it is not sufficient evidence that the connection has dropped. The old code, however, treated it as a client disconnect and proactively stopped reading from Azure.
The full error chain is shown below: a background flush fires while the SSE message is still being buffered, nothing to flush is misread as a disconnect, and the chain is cut before any response content goes out.
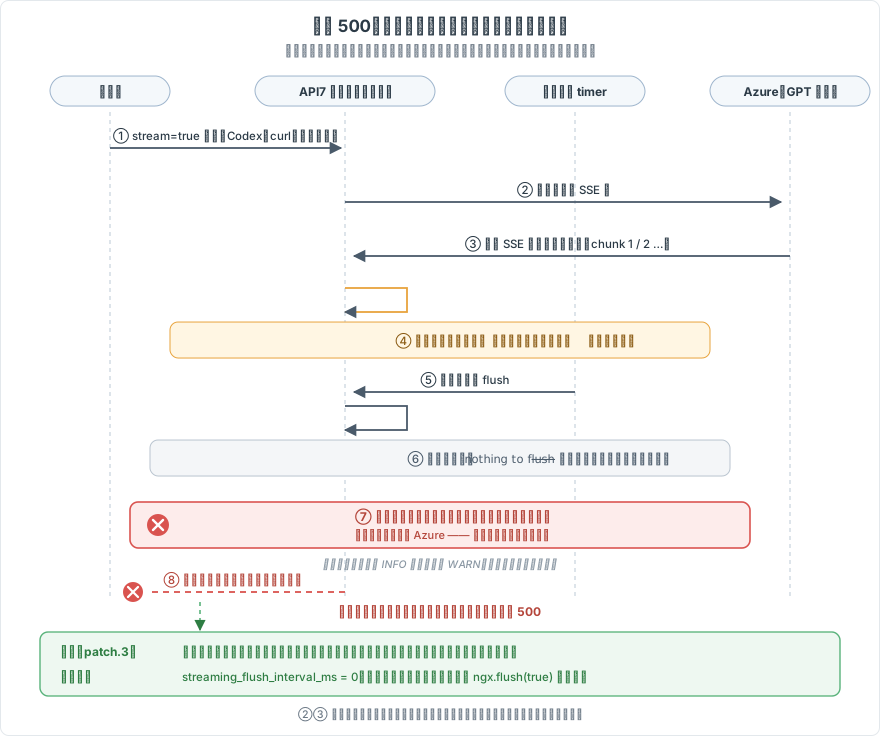
Whether it triggers depends on the relative order of chunk arrival and the periodic flush; long responses are not a precondition, which is why it comes and goes.
There is one more trap that inflated the debugging cost: the misjudged-disconnect record is logged at INFO level, while production is configured at WARN, so no corresponding log line was visible. The eventual diagnosis rested on the reproduction result compared against the streaming-path code, not on logs. The absence of an error log does not mean the error path did not run.
Mitigation and fix
The temporary mitigation was to set streaming_flush_interval_ms to 0 on the affected routes. It proved effective in production, with no need to drop tools or disable streaming.
The parameter belongs to the ai-proxy plugin; ai-proxy-multi exposes it as well. The official documentation lists a default of 10, with values of 0 or greater. The two flush paths involved here:
- Greater than 0: a background timer calls
ngx.flush(false)every N milliseconds, batching prepared output into periodic flushes. - Equal to 0: the background flush timer is not enabled; flushing goes through the synchronous
ngx.flush(true)path instead.
Setting 0 avoids the problematic background path, but giving up batching may increase send overhead, so actual CPU changes need watching. ngx.flush(true) suspends the current request’s coroutine while waiting, not the whole Nginx worker; a slow client can still delay subsequent upstream reads for the current request — see OpenResty’s notes on streaming responses.
The rollout touched only the affected routes, watching 5xx, 499, client time-to-first-byte, worker CPU, and upstream latency. Once patch.3, which contains the code fix, passed validation, the temporary setting was removed and the default of 10 milliseconds restored.
The code fix has two parts: schedule a flush only after content has been handed to the downstream response handler, and when the flush reports “nothing to flush,” keep waiting instead of treating it as a disconnect. The SSE reassembly logic remains; the key to the fix is distinguishing “temporarily nothing to flush” from “the client is gone.”
Problem 2: multiple workers pegged while traffic stayed low
The root cause of Problem 2 is an index-sync regression in nginx-lua-prometheus-api7 1.0.0-1: a change in delete_count triggers an O(key_count) full slot scan, and the get and ttl calls in the scan contend for the shared dict’s global lock, burning user CPU. key_count is a historical cumulative value — it reached 570,000 in production at one point — which is why current traffic is irrelevant.
The hourly flush_expired() is a separate path. The counterexample from monitoring (below) shows that the amount reclaimed is unrelated to CPU; the cleanup is more like the trigger for short hourly spikes than the CPU cost itself. Rebuilding the Pods to zero the index state counts as stopping the bleeding; the real cure was rolling back that dependency.
Symptom and what we ruled out
After upgrading to patch.1, node 56 began showing CPU spikes of one or two minutes every hour, later escalating into dense clusters of repeated multi-worker saturation. In that snapshot, 9 of the OpenResty workers were above 99% and the 10th around 38%, for about 9.3 cores total — not a brief blip in a single worker, but 9 of 10 workers pegged simultaneously, nearly hitting the 10-core ceiling the license allows.
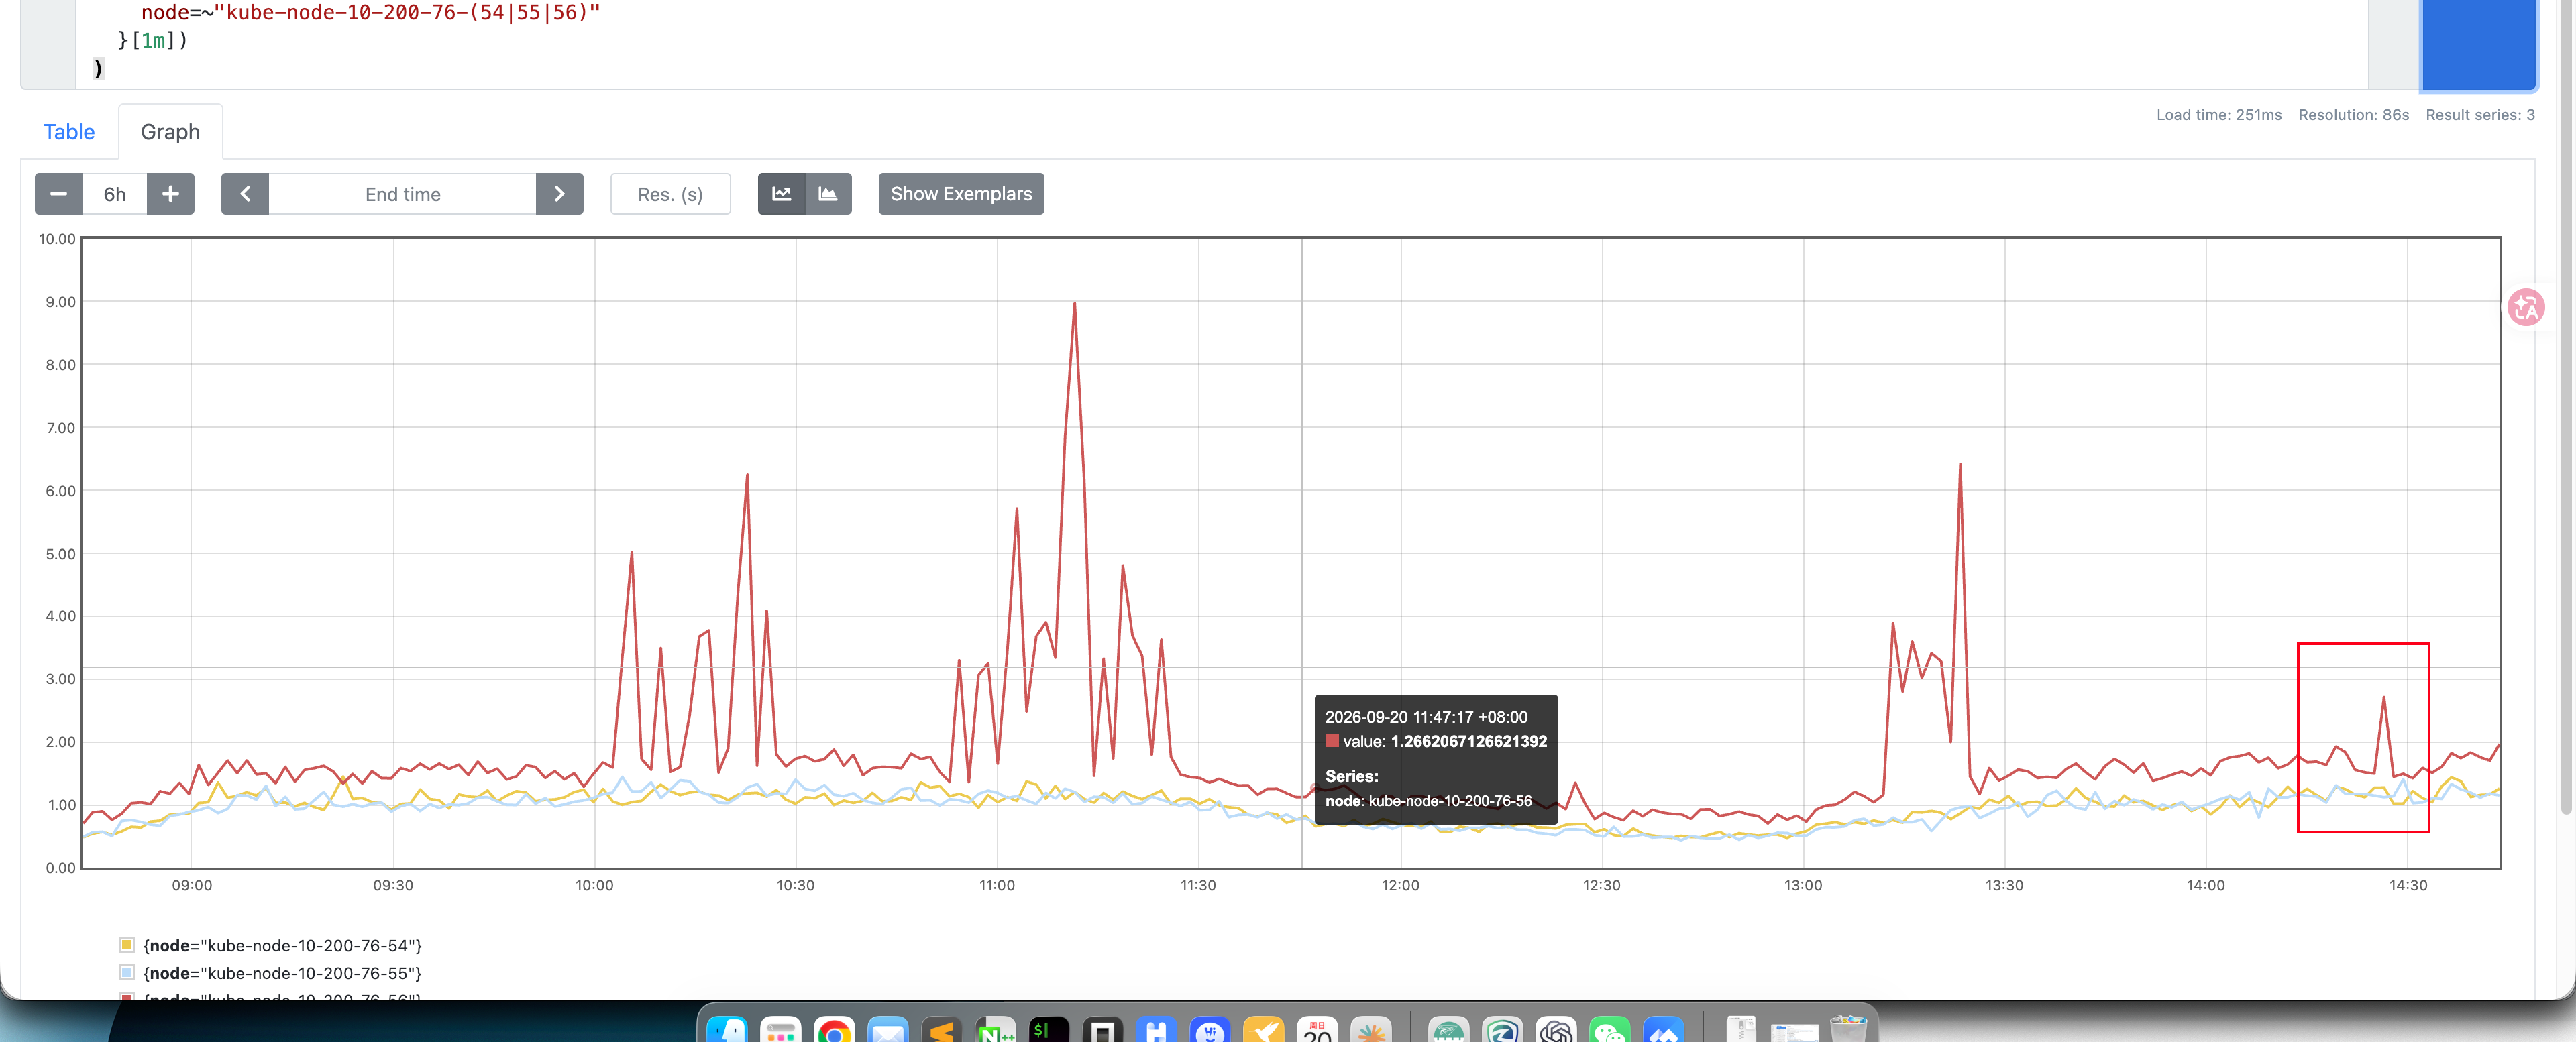
A traffic surge was the first hypothesis. But at peak, QPS on the three nodes was 77.5, 74.6, and 52.3 — node 56 had the lowest traffic yet drove CPU to about 9 cores (red line above), approaching the 10-core license ceiling, while the other two sat at 1.1 to 1.4 cores. The Elasticsearch logs showed no surge in request count, streaming requests, bytes in and out, or tokens either.
No matching anomaly in network, memory, or disk: soft interrupts were low, no packet loss or queue overflows, memory was plentiful with no swap, and iowait was near zero. During the anomalous window, roughly 97%–98% of CPU consumption was in user mode, so the investigation turned to OpenResty’s user-space execution path.
Nothing on the application side failed along with it: apart from the streaming 500s in Problem 1, no increase in 5xx was observed during the CPU spikes; the main user-visible impact was slightly higher response times, which we did not quantify separately. The symptom showed up as latency, not as errors — and precisely because nothing throws errors, problems like this are mostly discoverable only through CPU alerts and latency curves.
At this point I could only say that the current request volume cannot explain the CPU difference between nodes — but that was not yet grounds to declare it “completely unrelated to the workload.”
A monitoring counterexample: reclaimed volume does not track CPU
The most obvious suspect was that hourly cleanup timer. Test it first: is the CPU spike really caused by flush_expired()?
Aggregating two days of monitoring by minute shows that the CPU curve actually has two distinct shapes:
| Comparison | Pattern ①: short spikes at a fixed hourly time | Pattern ②: dense spike clusters |
|---|---|---|
| Shape | short spikes at a fixed time each hour, one to two minutes each | not a sustained plateau, but bursts of high-CPU multi-worker spikes, each lasting a few seconds to tens of seconds, with dips in between |
| When it appears | at the same time as the hourly cleanup; looking closely, the spike peaks 30–60 seconds after the cleanup and settles about 90 seconds in | wave after wave; the start and end of each affected block falls between two timer firings |
| Can the scheduled cleanup explain it? | only “why at this moment,” not the magnitude | not at all |
Why is the cleanup time fixed? Each worker runs cleanup every 3600 seconds from the moment its process starts, so it fires at the same second every hour — for example, 25 minutes and 30 seconds past the hour. A CPU spike can only be called cleanup-related if it appears at that same moment; the dense clusters clearly do not line up.
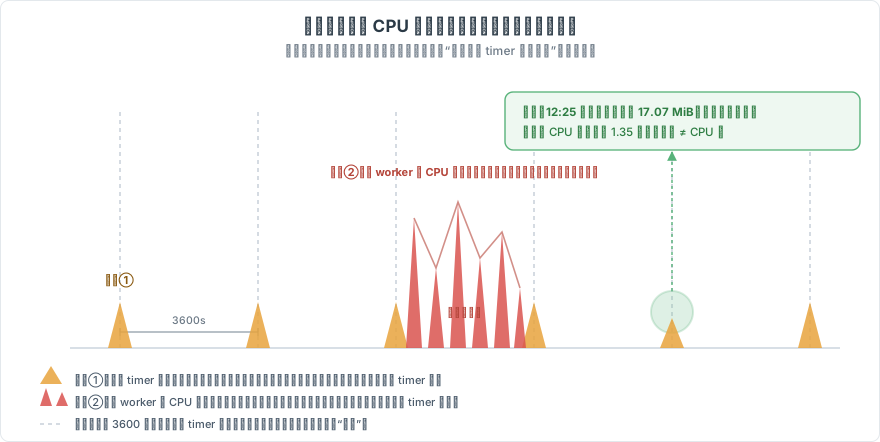
Now compare reclaimed volume against CPU: neither direction lines up. Reclaimed volume is the single-step drop in shared-dict occupied space; CPU is the node peak within ten minutes of the reclaim (rate over a 1-minute window, 30-second step; recomputing with a finer step gives the same result, so smoothing did not erase the spikes):
| Time (node 56) | Reclaimed | Node CPU peak | Highest single worker at the time |
|---|---|---|---|
| 09-16 14:18 (cleanup time) | 8.63 MiB | 4.74 cores | 1.00 core, 4 workers near saturation simultaneously |
| 09-16 23:22 (cleanup time) | 12.53 MiB | 0.78 cores | 0.14 cores |
| 09-20 12:25 (cleanup time) | 17.07 MiB | 1.35 cores | 0.18 cores |
| 09-20 14:45 (not a cleanup time) | 5.30 MiB | 7.35 cores | 0.76 cores, all 10 workers above 0.5 cores simultaneously |
The first two rows come from the 5-worker era; on the evening of September 17 the license per node was raised from 5 cores to 10 and the worker count went up to 10, so the last two rows are from the 10-worker era.
A large reclaim can cost almost no CPU. The 12:25:30 hourly cleanup ran as scheduled and shared-dict occupancy dropped a step — 17.07 MiB reclaimed in a single pass, the largest scheduled cleanup of the day, yet the node CPU peak was only 1.35 cores, with every worker under 0.2 cores. The same day at 12:22 and 12:29, the other two nodes reclaimed 19.75 and 18.82 MiB respectively, with CPU peaks of only 0.96 and 0.72 cores. A small reclaim can be expensive: at 14:45:00 only 5.30 MiB was reclaimed, yet node CPU shot to 7.35 cores.
Treating “5.5–21.8 MiB reclaimed per hour accompanied by 2.4–4.7 cores” on September 16 daytime as a rule means mistaking coincidence at the same moment for causation: later that night, at 22:22 and 23:22, two comparable reclaims of 8.14 and 12.53 MiB produced CPU of only 0.75 and 0.78 cores.
Tables alone can look cherry-picked, so here is node 56’s entire day on September 20 plotted on a single timeline: node CPU on top, each reclaim’s time and size below. Reclaims range from 1 MiB to 18 MiB and occur almost every hour outside the 3 a.m.–9 a.m. gap; yet the dense spike clusters appear only in the two blocks after 10 a.m. and after 1 p.m. The 17.07 MiB reclaim at 12:25 falls right in a quiet stretch, and the evening’s 8–18 MiB reclaims raised no spikes either. The orange reclaims in the chart — those outside the cleanup schedule — all sit under the spike clusters instead. Finally, pooling all 522 reclaim events of ≥1 MiB across the three nodes from 9/14 to 9/22, the correlation between reclaimed volume and the CPU peak within ±10 minutes is only 0.18.
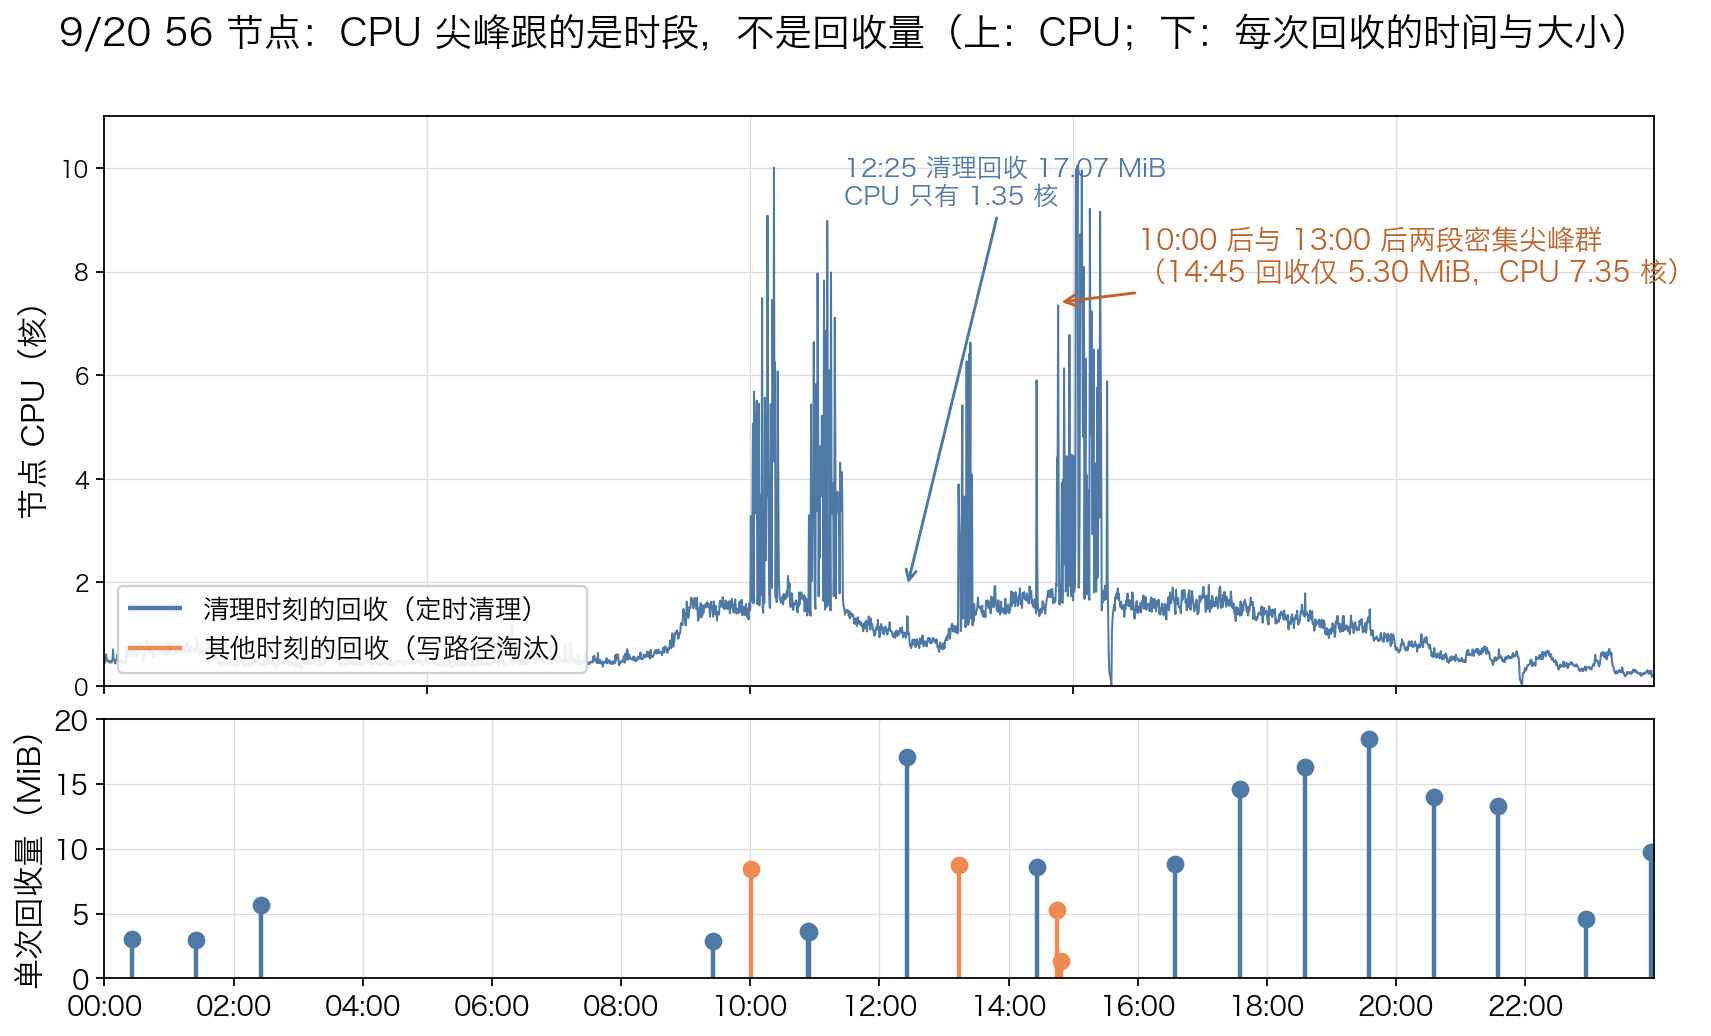
It is worth separating the sources as well: “space reclaimed” in monitoring does not come from a single path. What lands on the cleanup’s timestamp is flush_expired()‘s batch cleanup; reclaims off that schedule (like the 14:45:00 one) are more likely LRU eviction from the write path — two sides of the same churn that produces the dense spikes. Mix them into one metric and you get the odd result of “same reclaim volume, completely different CPU.”
So “how much was reclaimed” is not the independent variable: the scheduled cleanup at best explains when short spikes happen, not their magnitude, and certainly not the dense clusters. A second trigger path had to be found.
Dependency diff: two commits, two paths
Next, diff the full change surface of the upgrade — indirect dependencies included:
1 | 3.9.14 nginx-lua-prometheus-api7 0.20250302-1 |
The leads landed on two commits between those versions:
1 | 845084f 2026-06-23 bump the global delete_count in KeyIndex:add() when an expired metric reappears |
First: the full scan after a counter change. The key branch of KeyIndex:sync() is below (simplified excerpt, keeping only the branches relevant to the incident; for the full implementation see upstream prometheus_keys.lua‘s KeyIndex; API7’s fork is published as the LuaRocks package nginx-lua-prometheus-api7):
1 | -- N is the current upper bound of known slots; it grows with key_count |
The trigger chain: a metric slot configured with expire: 1800 expires and is physically reclaimed, but some worker’s local index still holds it; when a later request tries to renew it, dict:expire() returns not found, so add() re-registers it and the global delete_count increments. The next time other workers run sync() and find their local self.deleted out of sync, they execute sync_range(0, N):
1 | for i = 0, N do |
Every historical slot needs at least one shared-dict get; slots that still hold values need a ttl as well. The loop contains no yield point — other requests on the same worker, including streaming responses that are mid-output, have to wait for the scan to finish.
The trap here: key_count is the upper bound of slots ever allocated, and in this implementation it only ever grows; the scan cost depends on historical slots, not on the number of samples currently in /metrics. That is why low traffic can still peg a worker.
Second path: the unbounded hourly cleanup:
1 | function KeyIndex:remove_expired_keys() |
This call walks the LRU queue while holding the shared dict’s mutex. Each worker builds its own cleanup timer, using the library default remove_expired_keys_interval of 3600 seconds, which this version of APISIX does not override. So it can pull multiple workers in at the same moment every hour.
Compare the two paths side by side:
| Comparison | Path A: full scan after delete_count changes |
Path B: hourly flush_expired() |
|---|---|---|
| Trigger | any request that causes an expired metric to re-register | the cleanup timer every 3600 seconds |
| CPU shape | Pattern ②: dense spike clusters | Pattern ① lands on its schedule, but see attribution below |
| perf evidence | shared-dict lock hotspots in 17 of 23 profiles | flush_expired never captured in any of the 23 |
| monitoring evidence | the controlled reproduction’s worker signature matches both patterns | same-magnitude reclaims stay flat throughout (17.07 MiB → 1.35 cores, 12.53 MiB → 0.78 cores); the cleanup itself costs almost no CPU |
| verdict | the main cause of this batch of spikes | trigger and amplifier; insufficient evidence for an independent CPU source |
Pattern ①’s attribution needs one more check. Although it lands on the cleanup’s timestamp, three details do not fit “the cleanup itself burns CPU”: the spike peaks only 30–60 seconds after the cleanup and settles about 90 seconds in; the magnitude is independent of the reclaimed volume; and the worker distribution is 4 workers near a full core each with the rest low — exactly the Path A signature seen later in the controlled reproduction (a signature is the characteristic distribution of per-worker CPU usage, which can be used to infer the failure mechanism).
A more consistent reading: the timer’s batch reclaim merely pulls the trigger, and the CPU is actually spent on what follows — “expired metric re-register → delete_count changes → other workers do a full scan.” During the day, requests keep touching expired metrics, so re-registration follows immediately after cleanup; at night with no requests, a reclaim of the same size costs almost nothing.
The boundary should be stated too: all 23 perf profiles were taken during dense-spike windows where a single worker held ≥80% continuously; Pattern ① has no independent perf evidence, so that layer of attribution is an inference from timing and signatures.
Production configuration made the problem more likely: http_status, http_latency, and bandwidth are all configured with expire: 1800, and some metrics carry high-cardinality labels like app, project, and request_host; histograms further expand each label set into multiple buckets. Large numbers of time series are constantly created, expired, and re-registered. The pid label added during troubleshooting is used by only one metric, adds limited series, and is not a major factor.
Going from 5 to 10 workers may also amplify the concurrent contention.
perf evidence: the hotspot is the shared-dict lock
A script on the node sampled worker CPU every second; once it saw sustained ≥80%, it automatically captured a system snapshot and ran perf record, ultimately producing 23 profiles.
17 of them showed a shared-dict lock hotspot: median Self CPU for ngx_shmtx_lock was 66.47%, median Children CPU for ngx_meta_lua_ffi_shdict_get was 73.99%, and get_ttl was clearly lower. Self and Children are measured differently and must not be added together.
None of the 23 profiles captured the flush_expired symbol. Not captured does not mean never executed — but combined with the spikes appearing in clusters and not matching the timer’s fixed schedule, its likelihood as the main cause of this batch dropped substantially; the hourly cleanup’s risk is still on the books.
In the perf output, ngx_meta_lua_ffi_shdict_get, ngx_meta_lua_shdict_lookup, and ngx_meta_lua_ffi_shdict_get_ttl correspond to get, dict lookup, and ttl. get and ttl each need to acquire the same lock, and the spin-backoff on acquisition failure consumes CPU. This is not one worker holding the lock while scanning the whole index; it is multiple workers each scanning and contending for the same lock as they repeatedly touch the shared dict — a different contention pattern from flush_expired() holding the lock through a single cleanup walk.
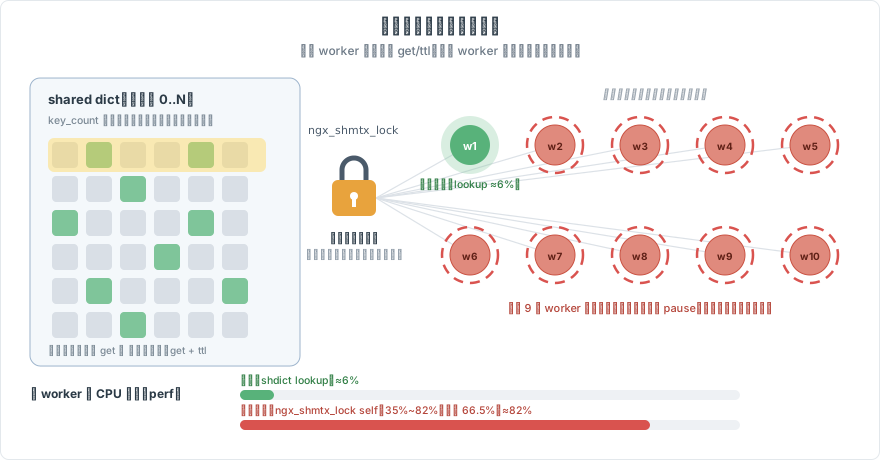
High get and low ttl fit the model of “many historical slots already invalid,” but slot counts cannot be inferred from that alone. When the dense high-CPU clusters hit, 9 to 10 workers repeatedly fall into the hotspot at the same time.
Internal counters and controlled reproduction
key_count and delete_count were not exposed as metrics at the time; I read them through a temporary diagnostic endpoint restricted to operations-only access. Reading them required distinguishing the global counters from worker-local caches, and aligning the readings with each worker’s CPU and the shared dict’s free space on one timeline. Such endpoints should be deleted once troubleshooting ends.
key_count on node 56 reached 570,000 before the instance was rebuilt and dropped to just over 10,000 afterward. The former means one full sync has to scan hundreds of thousands of historical slots. key_count indicates scan size; changes in delete_count indicate that the next sync may take the full-scan path.
The controlled experiment used the same-version image with 5 workers: first construct already-reclaimed slots, then trigger one counter change. It reproduced the production pattern: the worker that initiated the change stayed at low CPU while the other 4 simultaneously approached a full core each (why the initiator stays low was not pursued further). The reproduction still worked with external metric scraping removed, showing scraping is not a necessary condition.
Condensed into minimal reproduction steps (these describe the necessary conditions and their order; exact commands and configuration vary a bit by version):
- Start an instance with the same-version image (
nginx-lua-prometheus-api7 1.0.0-1), 5 workers; - Configure metrics with
expire: 1800, preferably with high-cardinality labels, to create continuous slot allocation and expiry; - Wait for slots to be physically reclaimed while each worker’s local
KeyIndexstill holds the old indexes; - Trigger one “expired metric re-registration” so the global
delete_countchanges; - Observe: the worker that initiated the change stays low while the rest simultaneously approach a full core each, for a few seconds to tens of seconds; an
ngx_shmtx_lockhotspot is visible in perf; - Still reproducible with external Prometheus scraping removed.
The dependency change provided the trigger mechanism, perf pointed to lock contention, the internal counters explained the scan size, and the controlled experiment reproduced the multi-worker high CPU. The vendor’s final report (API7) also confirmed the root cause — only at that point did all the evidence lines truly line up.
Stopping the bleeding, configuration mitigation, and the code fix
First, stop the bleeding: after reading the counters on all three nodes, I deleted and recreated the gateway Pods one at a time. An ordinary reload preserves the shared dict; rebuilding the instance cleared the accumulated index state, and the CPU spikes temporarily stopped. But this only zeroes state; it does not fix the bug.
If the code fix cannot be delivered right away, configuration changes can reduce the trigger and amplification conditions:
- Tame high-cardinality labels: prioritize metrics that carry an expiry, and remove non-essential
app,project,request_hostdimensions and ad-hoc troubleshooting labels. - Revisit the expiry policy: extending expiry reduces short-cycle reclaim and re-registration; disabling expiry requires evaluating time-series count and shared-dict capacity first — do not trade a state-growth problem for a capacity problem.
- Distinguish the two paths: raising
remove_expired_keys_intervalonly lowers how often the scheduled cleanup runs; it does not fix the full scan triggered by adelete_countchange. Whether it can even be tuned depends on whether that version exposes a configuration entry. - Rolling instance rebuild: clears inflated historical state, but cannot substitute for the algorithmic fix.
Why we chose a wholesale rollback
Three options were on the table: keep patching the two defects on nginx-lua-prometheus-api7 1.0.0-1, revert only those two related commits, or roll the dependency back wholesale to 0.20250302-1, the version shipped with 3.9.14. We chose the third — the gateway stays on 3.9.19, keeping its other features and fixes, with only the Prometheus dependency rolled back to the 3.9.14 version, delivered via a new patch. This was not a downgrade of the whole gateway stack.
The rollback was chosen mainly for its certainty: the target is behavior that ran in production on 3.9.14 for a long time — a return to a known state. Continuing to patch on 1.0.0 means stacking patches on a new version, with a much higher regression-verification cost. Scope of change was also a consideration: both defects live inside the LuaRocks dependency, one in index sync, one in cleanup logic, and whether reverting a single commit works cleanly depends on whether later commits depend on earlier changes. The cost is equally clear: we give up whatever else changed between 1.0.0 and 0.20250302-1, and any future re-upgrade must first address these two commits, with acceptance testing covering the process of the index state re-accumulating.
Plainly put: the trade-off was not about which option was more elegant, but which one got us back to verified behavior fastest.
Node difference: why it was always node 56
While investigating the CPU issue, there was one more thing: same code, no obvious traffic surge, yet alerts almost all landed on node 56. A software bug cannot explain a severity difference like that; beyond current QPS, I had to compare process uptime, key_count, the rate of delete_count changes, and machine configuration.
Real machine-side differences did show up: all three run the Ubuntu 5.4.0 kernel but at different patch levels — 56 is 5.4.0-135-generic (built November 2022), while 54 and 55 are both 5.4.0-90-generic (built October 2021), so 56’s kernel is actually about a year newer. The CPU model is the same on all three, Xeon Silver 4110, but 56 shows a lower CPU MHz in lscpu. Checking the governor:
1 | cat /sys/devices/system/cpu/cpu0/cpufreq/scaling_governor |
powersave behaves differently across drivers and modes, so one cannot conclude the CPU was pinned at a low frequency from this alone — see the intel_pstate documentation. A single lscpu reading is also not representative of the whole incident window.
After unifying the governor, the effect was clear: comparing the same time window on the days before and after, node 56’s total CPU consumption curve moved down noticeably, and the gap between nodes narrowed with it. Node 56 was still slightly higher than the other two, though. Note also that this comparison did not separately control for historical index state and workload — it is an observational before/after in production, not a controlled experiment.
So the frequency-governor difference is best characterized as: a genuine amplifying factor, with a clear drop in the production before/after comparison, but its independent contribution was not quantified, and the remaining difference still has to be sought in kernel minor version, accumulated index state, and load distribution. The confirmed CPU root cause remains the Prometheus index-sync defect.
Outcomes and validation boundaries
These actions addressed different layers and cannot be uniformly summarized as “it got better after the upgrade”:
| Problem | Action taken and observed | Boundary of the conclusion |
|---|---|---|
| Streaming 500 | The set-to-0 workaround was effective in production; after patch.3 passed validation and was upgraded, the temporary setting was removed | Bypassing the background path and fixing the state check are two different measures |
| Multi-worker high CPU | After rebuild, cumulative counters dropped and CPU spikes have not recurred; the Prometheus dependency rollback (nginx-lua-prometheus-api7 back to 0.20250302-1) ships via a new patch |
Rebuilding clears state (stop-the-bleeding); the dependency rollback targets the regression path |
| Node difference | After unifying the governor, CPU dropped noticeably and the inter-node gap narrowed, but 56 is still slightly higher | A production before/after comparison; the frequency-governor contribution cannot be quantified separately; the remaining difference is unexplained |
Pitfalls and lessons
The easiest traps to fall into, together with a few judgment calls worth keeping.
- No error log does not mean the error path didn’t run. The misjudged disconnect was logged at INFO; configured for WARN in production, it is completely invisible.
nothing to flushis not a disconnect signal — it only means there is temporarily nothing to flush. Reasoning about network state from it will kill upstream reads that should have continued.- Restarts and instance rebuilds only zero state; they don’t fix bugs. The accumulated index in the shared dict can only be cleared by rebuilding the instance, but the regression remains, and the problem returns once state re-accumulates.
- CPU consumption depends on historically accumulated slots, not on current traffic or active metric count.
key_countonly grows; 570,000 historical slots are enough to peg the CPU at low QPS. - Reads on a shared dict also take the lock. The mass of
getandttlcalls in a loop can burn just as much user CPU, showing up as high CPU rather than iowait. - “Only one machine alerts” points to another layer. A software bug cannot explain severity differences between nodes; dig into kernel version, frequency scaling, power policy. But finding one configuration difference does not mean you have explained the difference — keep comparing other variables.
- Resource saturation does not mean application errors. During the dense CPU spikes there were no 5xx, only slightly higher response times; watching only the error rate misses this class of failure — resource alerts and latency curves matter too.
- Include indirect dependencies in the change surface. Diffing only the gateway code would have missed this Prometheus regression.
- Let counterexamples change your hypothesis — and re-check the measurement basis of your comparisons. Reclaiming 17.07 MiB at 1.35 cores while 5.30 MiB came with 7.35 cores shows “reclaimed volume” was never the independent variable of CPU; what I saw during the day on September 16 was coincidence, not causation. perf and the controlled reproduction narrowed the range further.
Two things to do earlier next time: capture perf immediately when dense clusters of multi-worker high-CPU spikes appear; and when reproducing, assemble the complete request, the original response, and a same-version environment in one go.
Still unverified and open questions
These conclusion boundaries need to be kept, to avoid reading “suspected” as “proven”:
- The independent contribution of
powersaveis not quantified: all we confirmed is that 56 was onpowersavewith a lower frequency; after unifying the governor, CPU dropped noticeably and the node gap narrowed, but 56 is still slightly higher; the remaining difference is unexplained, and no controlled comparison was run. To verify, first hold version, worker count, index state, and load constant, then switch governors on the same node and compare frequency, CPU, and request latency. What we do in the meantime: add kernel version, frequency scaling, and power policy to the node baseline checks, while keeping checks on application accumulated state. - Long-term effect not quantified: we have no quantitative evidence for how well the patch that fixed the CPU problem performs long-term — we did not record the patch’s full build number or observation duration, nor do we have pre/post error-rate and latency comparisons. So we can only say the fix has shipped and has not recurred in the short term; no conclusion on the long-term effect.
- Acceptance isn’t closed out yet: subsequent acceptance must cover normal traffic together with metric scraping, hourly cycles, and the re-accumulation of index state — not just the brief calm right after a rebuild.
Disclosure: how tooling was used
Most of the perf-report aggregation, monitoring correlation, and source-code triage in this investigation was done with automated tooling, and this postmortem itself was drafted and polished with an AI assistant (mimo-v2.6-pro). None of that changes the epistemics: judgment had to come back to the evidence on the ground, and no plausible-sounding explanation was allowed to stand when a counterexample contradicted it. For a fuller account of how tooling participated in the analysis, see Runtime Behavior Blind Spots: An AI-Assisted Postmortem of the API7 AI Gateway CPU Saturation Failures (in Chinese).
Related posts
- APISIX Gateway 504s After Exactly 15 Seconds: Tracing It to tcp_syn_retries
- Runtime Behavior Blind Spots: An AI-Assisted Postmortem of the API7 AI Gateway CPU Saturation Failures (in Chinese)
- What Makes a Good AI Gateway? From Boundaries to a Scorecard (in Chinese)
- From Model Management to an AI Gateway: Tying Assets, Traffic, and Cost into a Closed Loop (in Chinese)
This article is the English edition of a post originally published in Chinese.